GROUP MODEL BUILDING

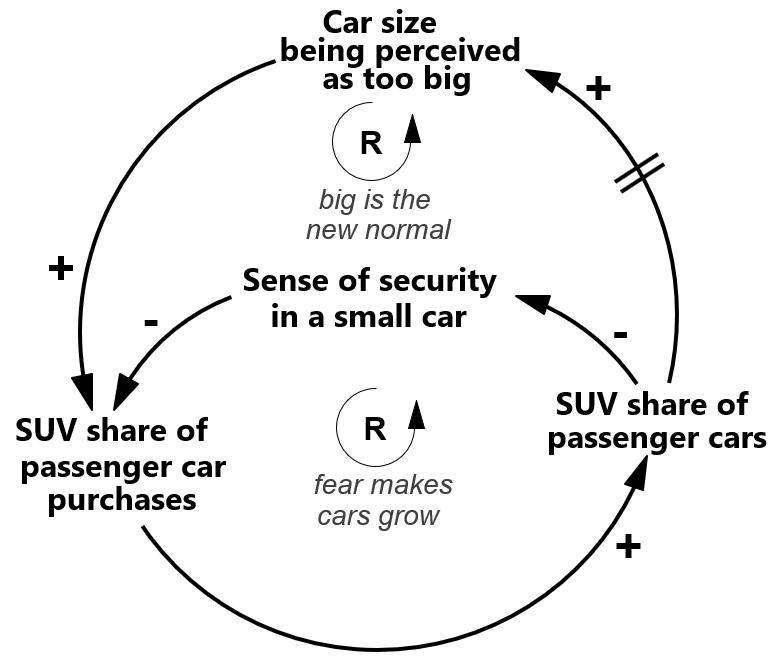
Figure: Example of a Causal-Loop-Diagram as used in GMB.
+ Reaction to change in the same direction,
– Reaction to change in the opposite direction
The more people are buying SUVs, the higher the presence of SUVs on the road (fraction of cars that are SUVs). However, the higher this fraction becomes, the less safe people feel in non-SUVs and are therefore more inclined to buy an SUV themselves which implies an increasing fraction of people buying SUVs. In other words, this is a vicious cycle (a reinforcing feedback loop), here termed“ fear makes cars grow”. Importantly, this feedback loop leads to a path dependency: once cars have shifted to bigger sizes, it is difficult to get back to smaller sizes. Furthermore, there is a second vicious cycle (“big is the new normal”): An increased fraction of SUVs over time (the double strike indicates a delay) tends to increase the size of car, that is perceived (too) big, which also increases the likelihood of people buying SUVs and therefore also the fraction of people doing so.
The GMB method was developed based on the System Dynamics method in order to meet the challenges of the increasing complexity of problems and their inherent uncertainty as well as of increasing need for inter- and transdisciplinary participatory processes:
GMB manages complexity without oversimplifying it by using special graphical representations known as Causal-Loop-Diagrams (CLD) (see simplified examples below in Figurethe diagram) and Stock-and-Flow-Diagrams (SFD). These CLDs and SFDs represent the causal connections between different parts of a complex system in a formal way that aid in understanding how the parts together can create developments at the system level that would otherwise seem surprising and hard to understand. If need be, Stock-and-Flow-Diagrams can be further developed into simulation models.
The co-creative process of model construction by M-Five experts leads to an enhanced understanding of trade-offs and goal conflicts between potential policies, but also to uncovering potential for desirable synergies and their maximization through clever combination in a coherent strategy.
The increasing need for participation stems in part from the need for organizational units or whole organizations to collaborate in an interdisciplinary fashion. In addition, there is an increasing requirement for citizen participation (i.e. transdisciplinary work): Either because the legislative framework requires it (EU-directive 2003/35/EC and Public-Participation-Law at the federal German level) or because project success strongly depends on stakeholder consent. Some projects go beyond mere consent requiring intensive active participation of stakeholders.
In order to meet these participation needs, our GMB experts combine pronounced participatory process elements with graphical causal modelling. This combination avoids turf-wars and instead promotes creative, effective collaboration in an integral co-creative process. The synthesis of the partial knowledge of the participants in the causal model brings about a shared deeper understanding of the problems and the causal structures underlying them. This synthesis gives birth to new knowledge via Synergy, which usually uncovers new leverage points towards solutions. This understanding combined with the unfolding group dynamics (team spirit fostered by individuals feeling empowered and visible team achievements) lead to commitment for implementing the solutions developed.


